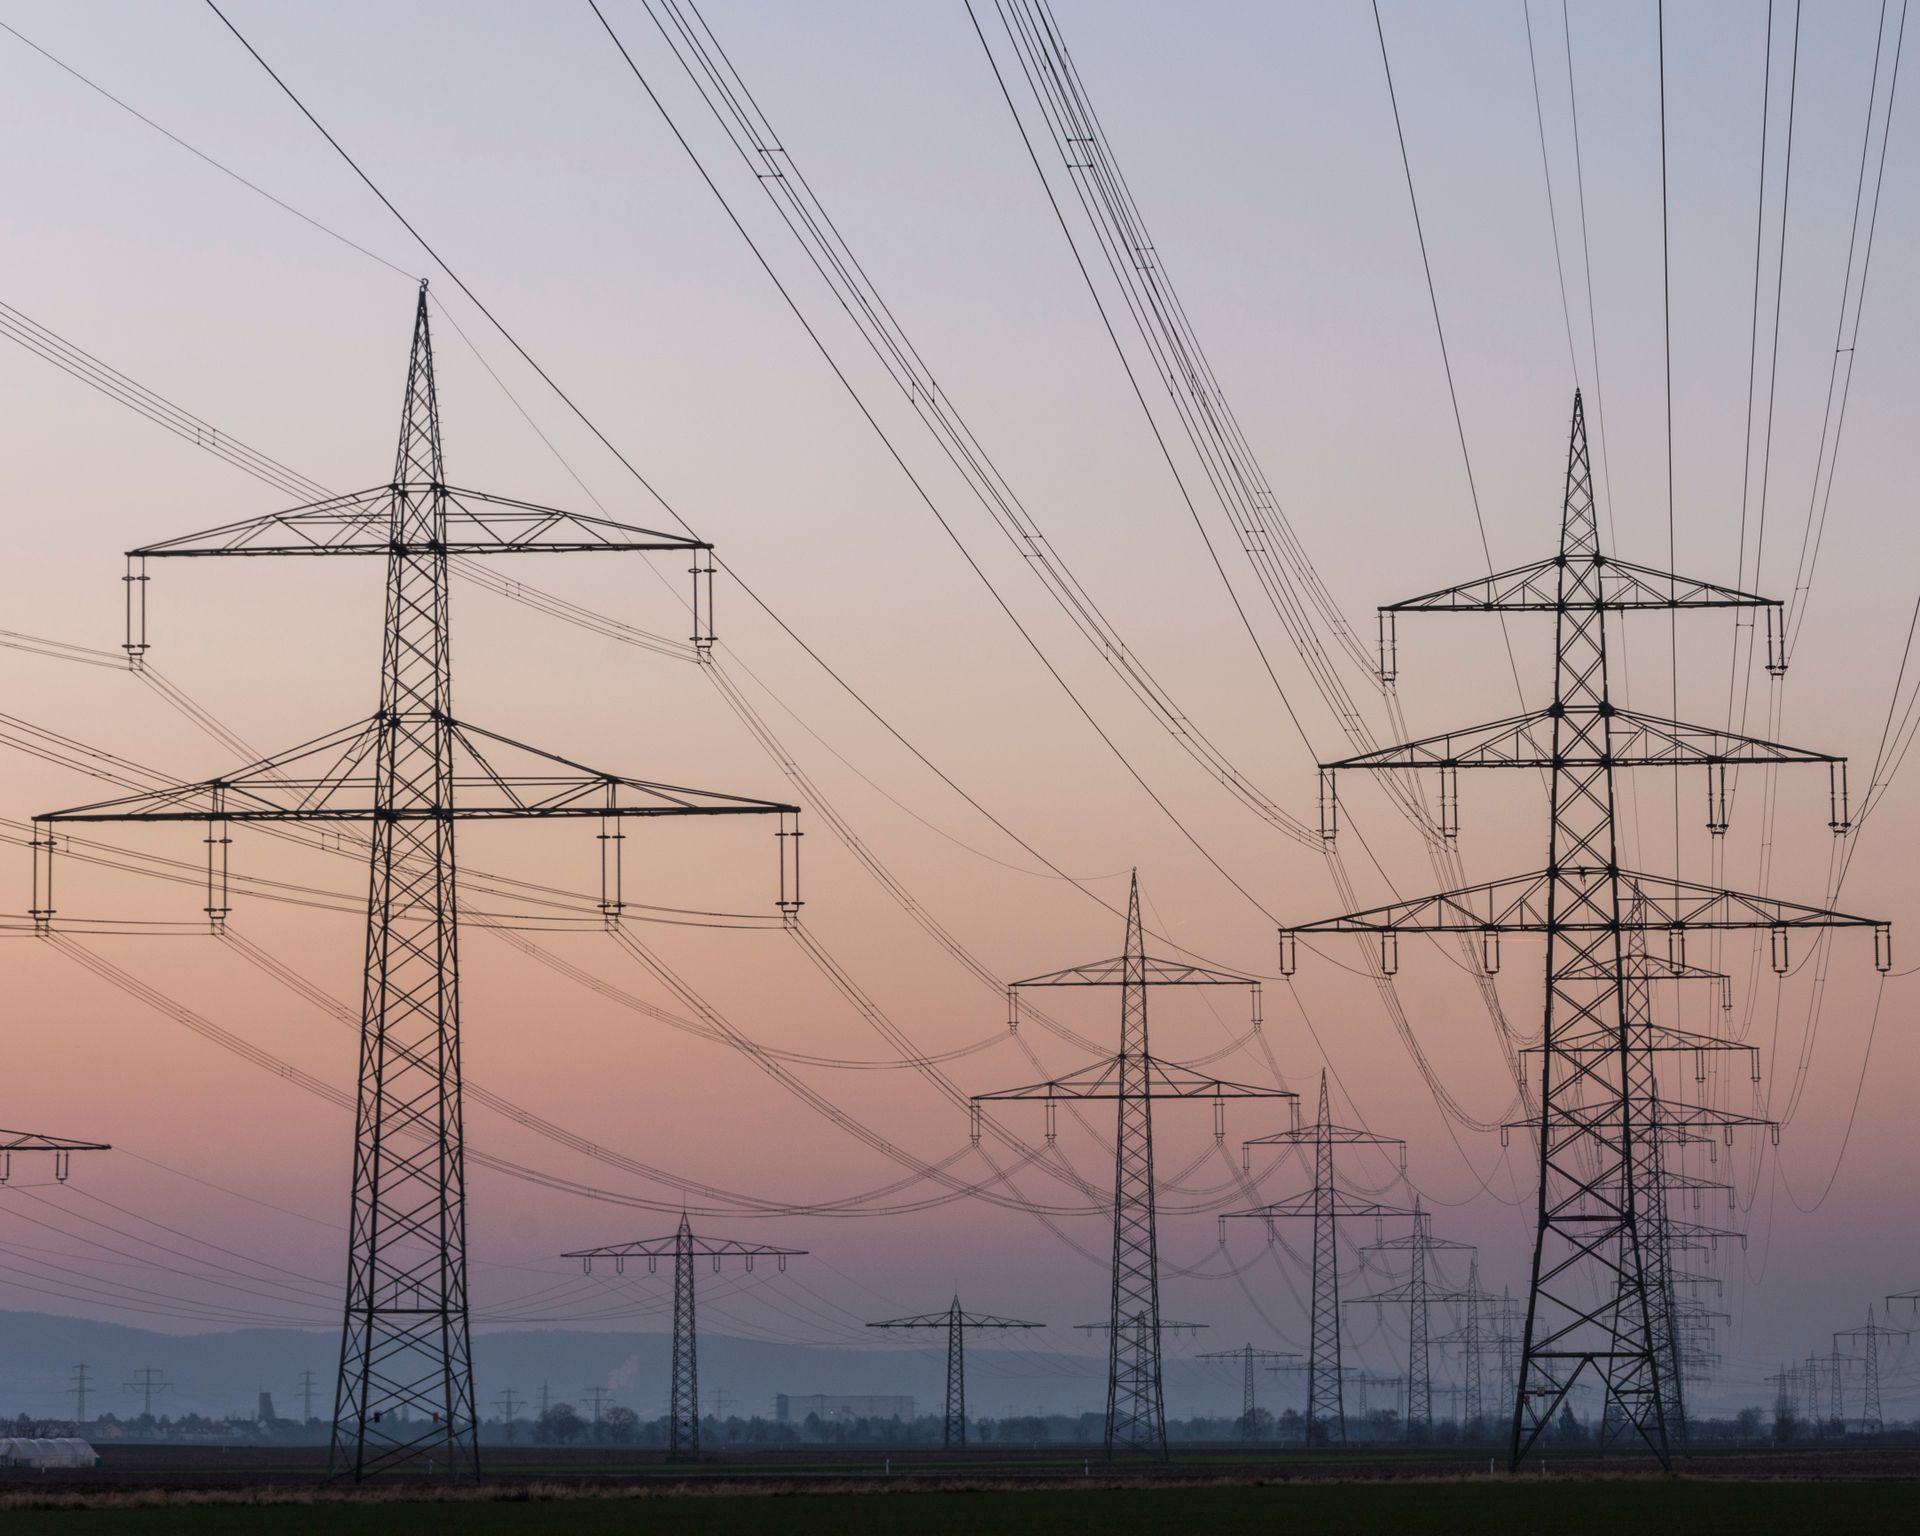
Critical infrastructure, seen as one system.
Energy, water, transport, telecoms, oil and gas, and public safety can be modelled as one connected system on a live ontology. Operators and the authorities that supervise them can then work from one operating picture and the same facts.
Sites and endpoints: Mi-C3 figures
Critical infrastructure operations run under conditions most software never meets.
Six conditions apply in every sector on this page. Together they decide what operating software must do: give each decision its full context, show dependencies before they cascade and keep the record as the work is done.
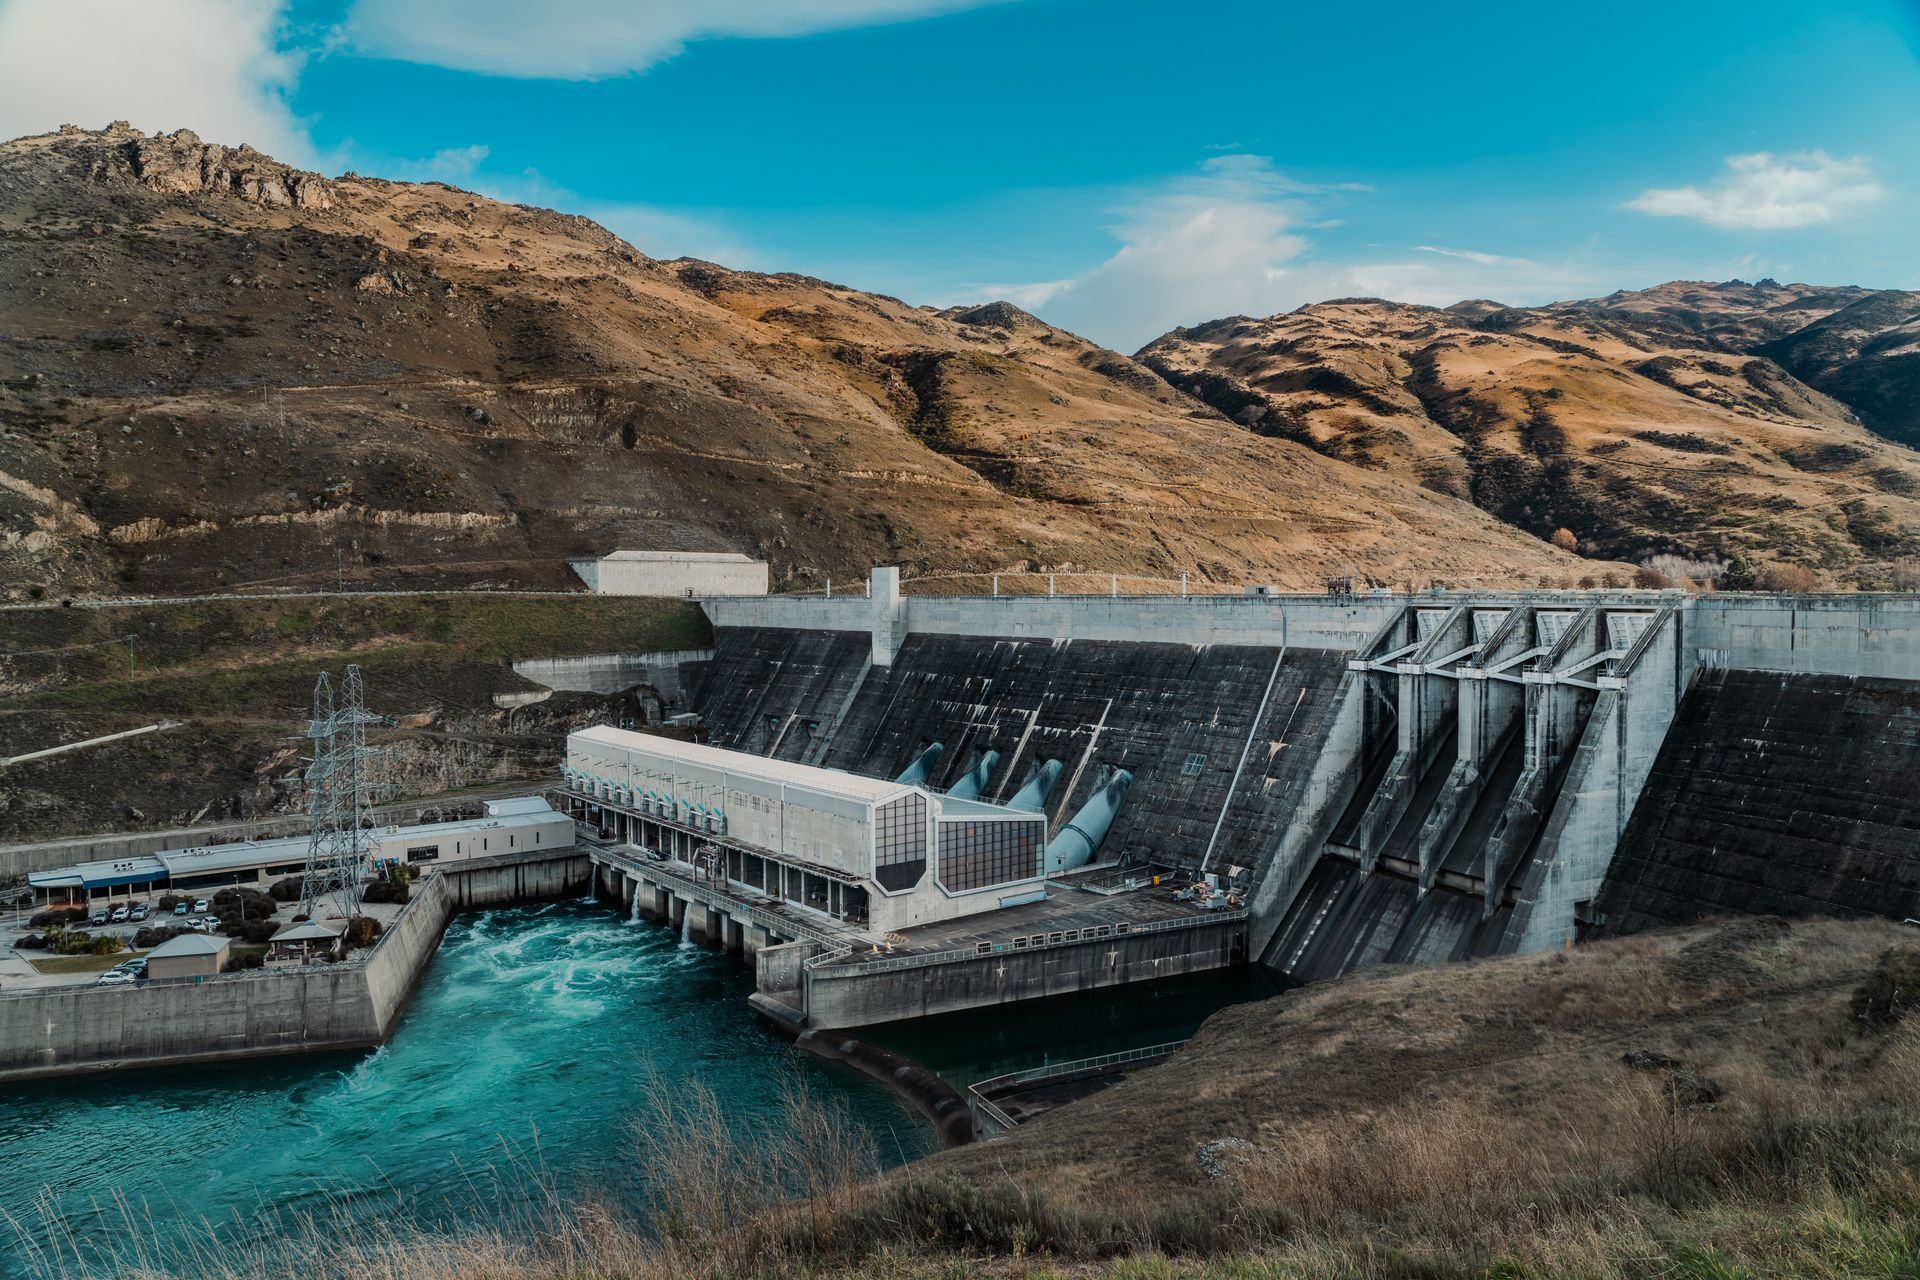
Every action has a physical consequence.
Switching, isolation and site entry put people at risk. Each instruction needs the full context, the right approval and a record of who did what.
Failures travel across sectors.
A substation fault stops a pump station. A pump station outage reaches a hospital. Operators need to see the dependencies before they cascade.
Evidence is a legal duty.
The NIS2 Directive (EU) 2022/2555 sets reporting clocks of 24 hours, 72 hours and one month; the CER Directive (EU) 2022/2557 sets 24 hours and one month. The record has to exist before the incident does.
Control systems outlive every project.
SCADA and telemetry stay in service for decades. They cannot stop for an integration programme, and many were never designed to share data.
No single supplier sees the whole.
SCADA from one vendor, GIS from another, an asset register from a third and dozens of field contractors. Each system is right about its own slice.
The work happens far from the control room.
Crews, contractors and patrols need the same picture as the control room, on phones and tablets, wherever the asset is.
The same three principles, in every sector.
Affectli, built by Mi-C3, works the same way in a water utility, a port or a tower network: a live ontology of the operation, a data fabric that forms one connected layer across the systems already running, and data sovereignty for the operator.
Explore Affectli ↗A live model of the whole operation.
Substations, pump stations, berths, cell sites and pipeline segments become objects with live properties, links and permitted actions. Every alarm arrives with its asset, its site and its crew.
Ontology for critical infrastructure →Connects to everything you run. Replaces nothing.
Affectli connects to SCADA, telemetry, GIS, asset registers, CCTV and business systems and leaves each of them in place, so control rooms keep working while the picture builds.
Inside the data fabric →Your data. Your ontology. Your infrastructure.
The operator owns its data by contract and chooses where Affectli runs: as a hosted service or on its own premises. Access follows classification and role, down to database, table and column.
Data sovereignty for critical infrastructure →- Your systems stay where they are. Nothing is replaced.
- Affectli connects to each of them, where they run.
- Every reading is checked on its way in.
- Every sector’s systems become one live picture.
Six sectors. One operating discipline.
Each sector has its own systems, vocabulary and regulators. Underneath, the work is the same: know the assets, see the dependencies, coordinate the people and keep the record. Together, the six form one picture of the infrastructure a country depends on.
When a storm crosses sectors, one record holds the chain.
A power line trips, a pump station stops, and a hospital and the cell site that serves it move to backup power. Held as links in the ontology, those dependencies are visible before a crisis tests them. Here is one such morning, minute by minute.
- An amber wind warning: a storm is coming in off the sea.
- Power line 31 trips, and 3,410 homes and businesses lose power.
- Then the chain: the pump station stops, the reservoir starts to fall, the hospital and its cell site go to backup.
- The cell site that serves the hospital runs out first, in 4 hours.
- The surge floods the coast road, so the crew takes the inland road. A generator and a message to the telecoms operator go out from the same record in Affectli.
- Weather
An amber wind warning covers the northern region. The ontology lists the substations, pump stations and cell sites in its path.
- SCADA
FDR-31 trips at SUB-2207. GIS resolves 3,410 homes and businesses off supply.
- Ontology
PS-14 sits on FDR-31 and stops pumping. RES-03 now holds 19 hours of supply at current demand.
- Priority
HOSP-01 is flagged: on generator with 36 hours of fuel, and fed by RES-03. CELL-0912, which serves it, is on battery with 4 hours left.
- Action
The surge has closed the A12 coast road at the river mouth, so CRW-14 is dispatched by the inland road. A work order for a mobile generator at PS-14 is raised and the telecoms NOC is notified.
- Record
The incident holds affected services, users affected and every action taken, ready for the 24-hour notification.
Times, assets and figures are invented for demonstration. In practice, each operator sees the objects its access policy allows.
Start with one site and the systems already there.
Request a briefing with the Mi-C3 team. Tell us the operation you run, or the sector you supervise, and the obligations that apply. We will show how the ontology connects your existing systems into one operating picture.